The Airbnb logo with the words 'Your home away from home' beneath it.

The Roadmap to
Creating the Right Conditions
& Authentic Data Collection

Qualitative &
Quantitative Data

A printable worksheet titled 'Decision Desk' with a question about whether current decisions impact the future. It includes spaces for a name, grade, and yes/no responses, and features a black header and footer with the logo of 'ANALYTICS' and a website link.
A young man smiling, wearing a black durag, gold chains, and a black and white sports jacket with red accents. Behind him is a wall with a colorful autumn leaves and tree mural.
School survey form asking students to choose the top two people who encourage them most at school, with options including friends, family, teachers, coaches, and school counselors.
Line graph titled 'What needs to be improved on your campus?' with curves representing different academic years: freshmen in red, sophomores in blue, juniors in yellow, and seniors in orange. The lines show varying trends across categories labeled 'TEAM.', 'OTHE.', 'COMU.', 'SCH.', and 'INDIV.'.
Black circle with white text that says "Team Building & Leadership"

Our Innovative Approach

Circular diagram with a black background and white border, containing the text 'Data, Research & Results' in the center.
Close-up view of a black and white icon resembling bold, stylized letters 'D' and 'U'.
Graphic text reads 'Reimagining Student Engagement & Data Collection' in bold white letters with a black background.

01.

A slide with a header saying 'Establish Trust & Belonging First' and a subtitle of a handshake icon. The slide contains text emphasizing creating safe environments where students feel seen, heard, and valued, to unlock honest responses, especially in qualitative formats. A quote at the bottom reads 'Safe spaces produce authentic voices.'
Orange arrow pointing downward on a black background.

02.

A graphic with an orange heart icon on the left. Text reads: 'CULTIVATE STUDENT AGENCY & ENGAGEMENT. Design activities and interactions that empower students with choice, voice, and ownership. When students feel their input shapes their learning, their responses become richer and more meaningful. "Participation is not enough—authentic engagement is key."'}
Orange curved arrow pointing down and to the right.

03.

Text about fostering reflection through creative methods, with a quote: 'Self-awareness amplifies data accuracy'.
A black illustration of a snail with an orange arrow pointing downward through its shell.
Black and white illustration of a person with a raised arm, standing next to a large measuring scale or height chart. An orange arrow points downward at the person's head.

04.

A presentation slide with a logo of two orange bars and the heading 'Align Data to Context—Not Just Content.' The slide discusses the importance of collecting real data under appropriate conditions to reflect genuine context, emphasizing that real data comes from real situations.
Black chalkboard with handwritten text and orange arrow pointing left. Text reads: "Learn more about me".
Hand-drawn orange arrow pointing left on a black background.
A presentation slide titled 'AP Analytics - Framework Understanding Our Innovative Approach' with a section labeled '01. Data Without Connection Falls Flat.' The slide discusses the importance of connection in data collection and analysis, listing methods such as shadowing, listening sessions, interviews, focus groups, and surveys.
A digital graphic illustrating the AP Analytics framework with a black background, white and orange text, and a flow chart. The chart shows the process from starting line to finish line, highlighting that everyone’s approach attempts to collect data through shadowing, listening sessions, interviews, focus groups, and surveys for analysis.
A diagram illustrating the AP Analytics framework, focusing on understanding the innovative approach of creating the right conditions with elements like creative lessons, safe spaces, fostering creativity, student-led choices, and team building, followed by data collection methods like shadowing, listening sessions, interviews, focus groups, and surveys.
Slide from presentation titled 'AP ANALYTICS — FRAMEWORK' discussing understanding innovative approaches, emphasizing the importance of authenticity requiring intention, and highlighting key points such as creating the right conditions, innovative methods, safe spaces, fostering creativity, student participation, and leadership.
A digital infographic titled 'AP Analytics - Framework', discussing innovative approaches to understanding authenticity through creative lessons, safe spaces, fostering creativity, student choices, and leadership.
A dashed peach-colored line forming a looping, curvy path on a black background.
Illustration of a dotted orange path with three points, set on a black background, resembling a concept map or journey diagram.
A black and orange line graph showing a smooth upward trend with a dashed orange curve and a solid orange circle at the end.
Black background with a continuous orange dashed line forming a winding path, and orange circle markers at various points along the line.
A digital infographic depicting a workflow for data collection and analysis. The timeline starts with a section titled 'Data Without Connection Falls Flat,' emphasizing the importance of real data for insights. The next section, labeled 'Everyone's Attempted Approach: Data Collection & Analysis,' lists methods such as shadowing, listening sessions, interviews, focus groups, and surveys. The timeline concludes with a 'Finish Line' marker.
Infographic describing an innovative approach to creating the right conditions for a project, including shadowing, listening sessions, interviews, focus groups, and surveys.
Flowchart showing two approaches: an innovative method for creating the right conditions including shadowing, listening sessions, interviews, focus groups, and surveys; and an attempted approach for data collection and analysis with similar steps.

VIEW OUR DATA

Abstract digital artwork with a gradient of blue and purple colors, forming a curved, glowing shape on a black background.

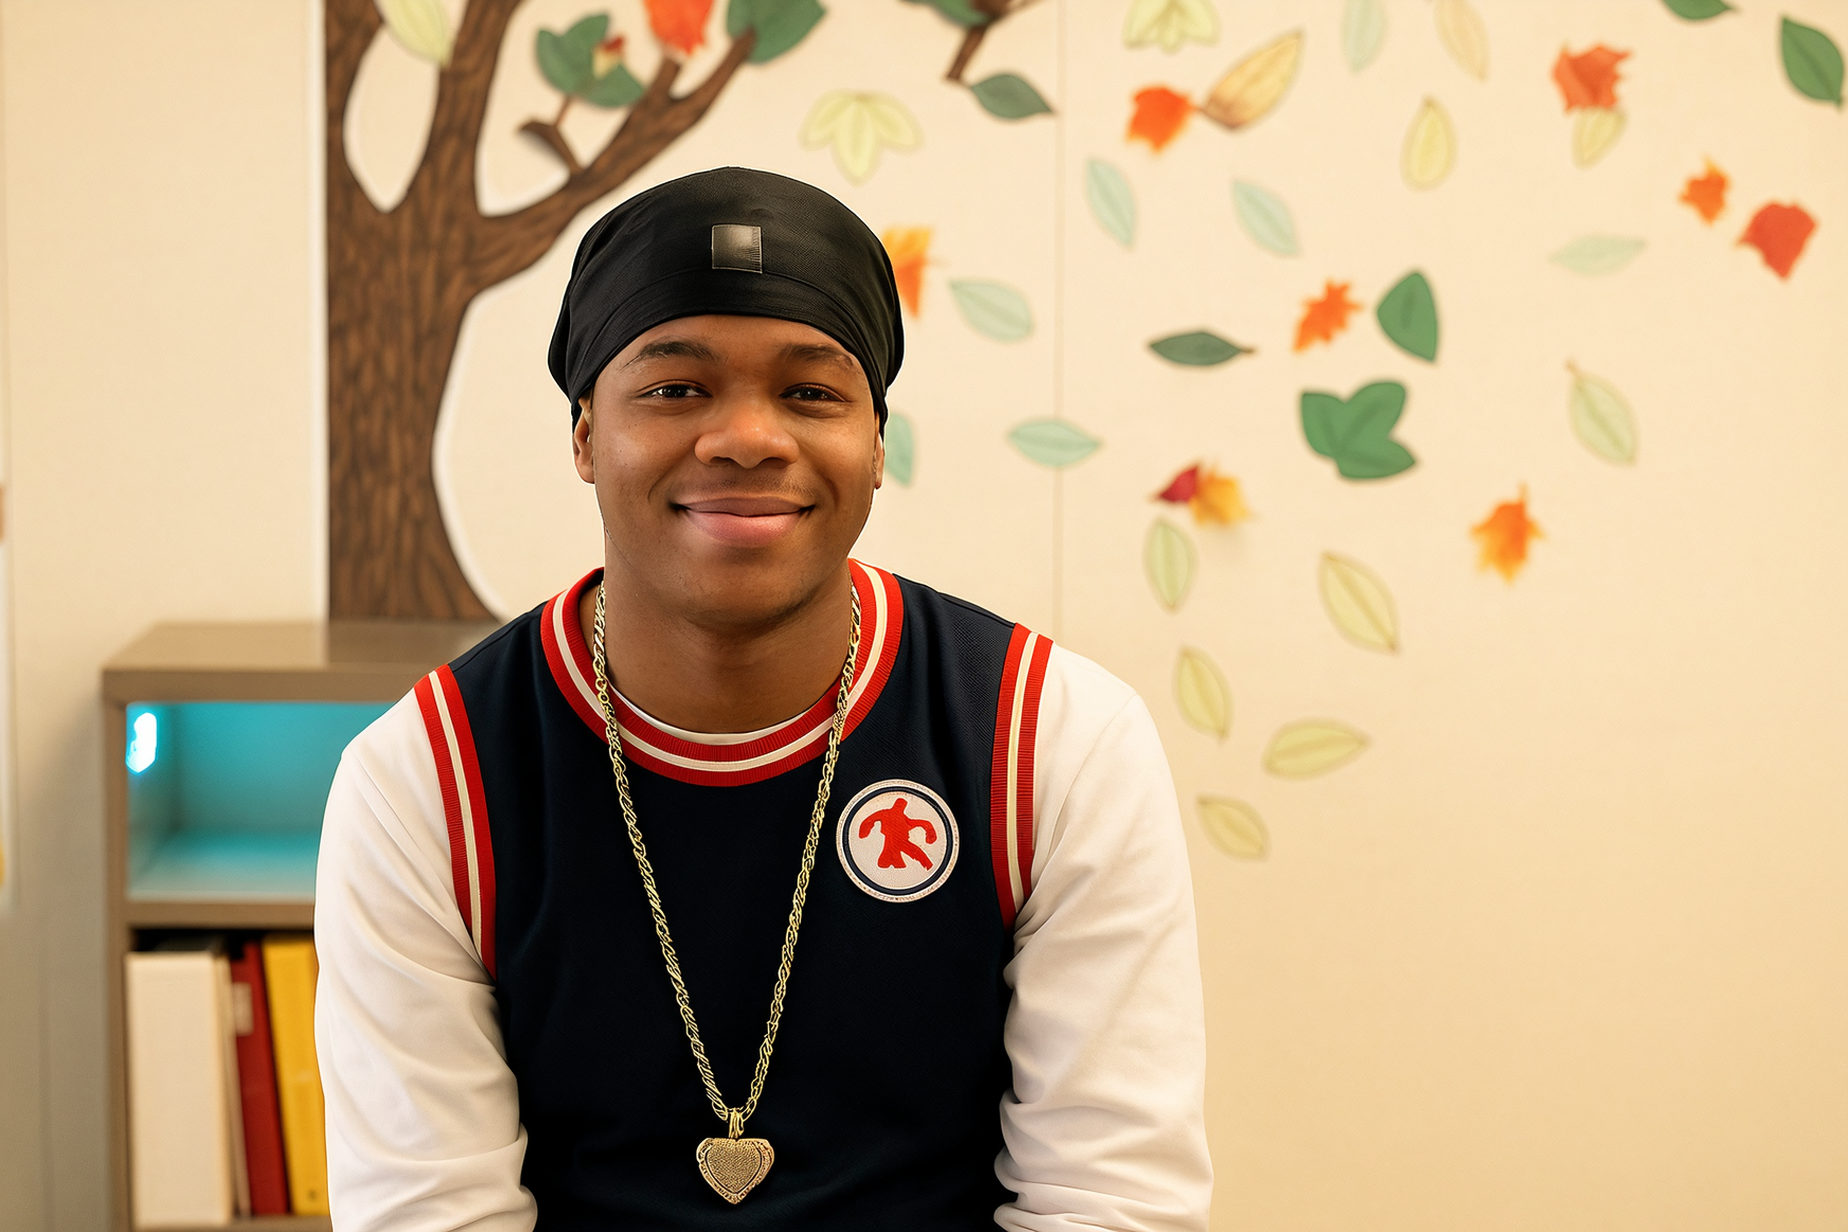
Dreaming with Students as Partners
An LPAR Partnership

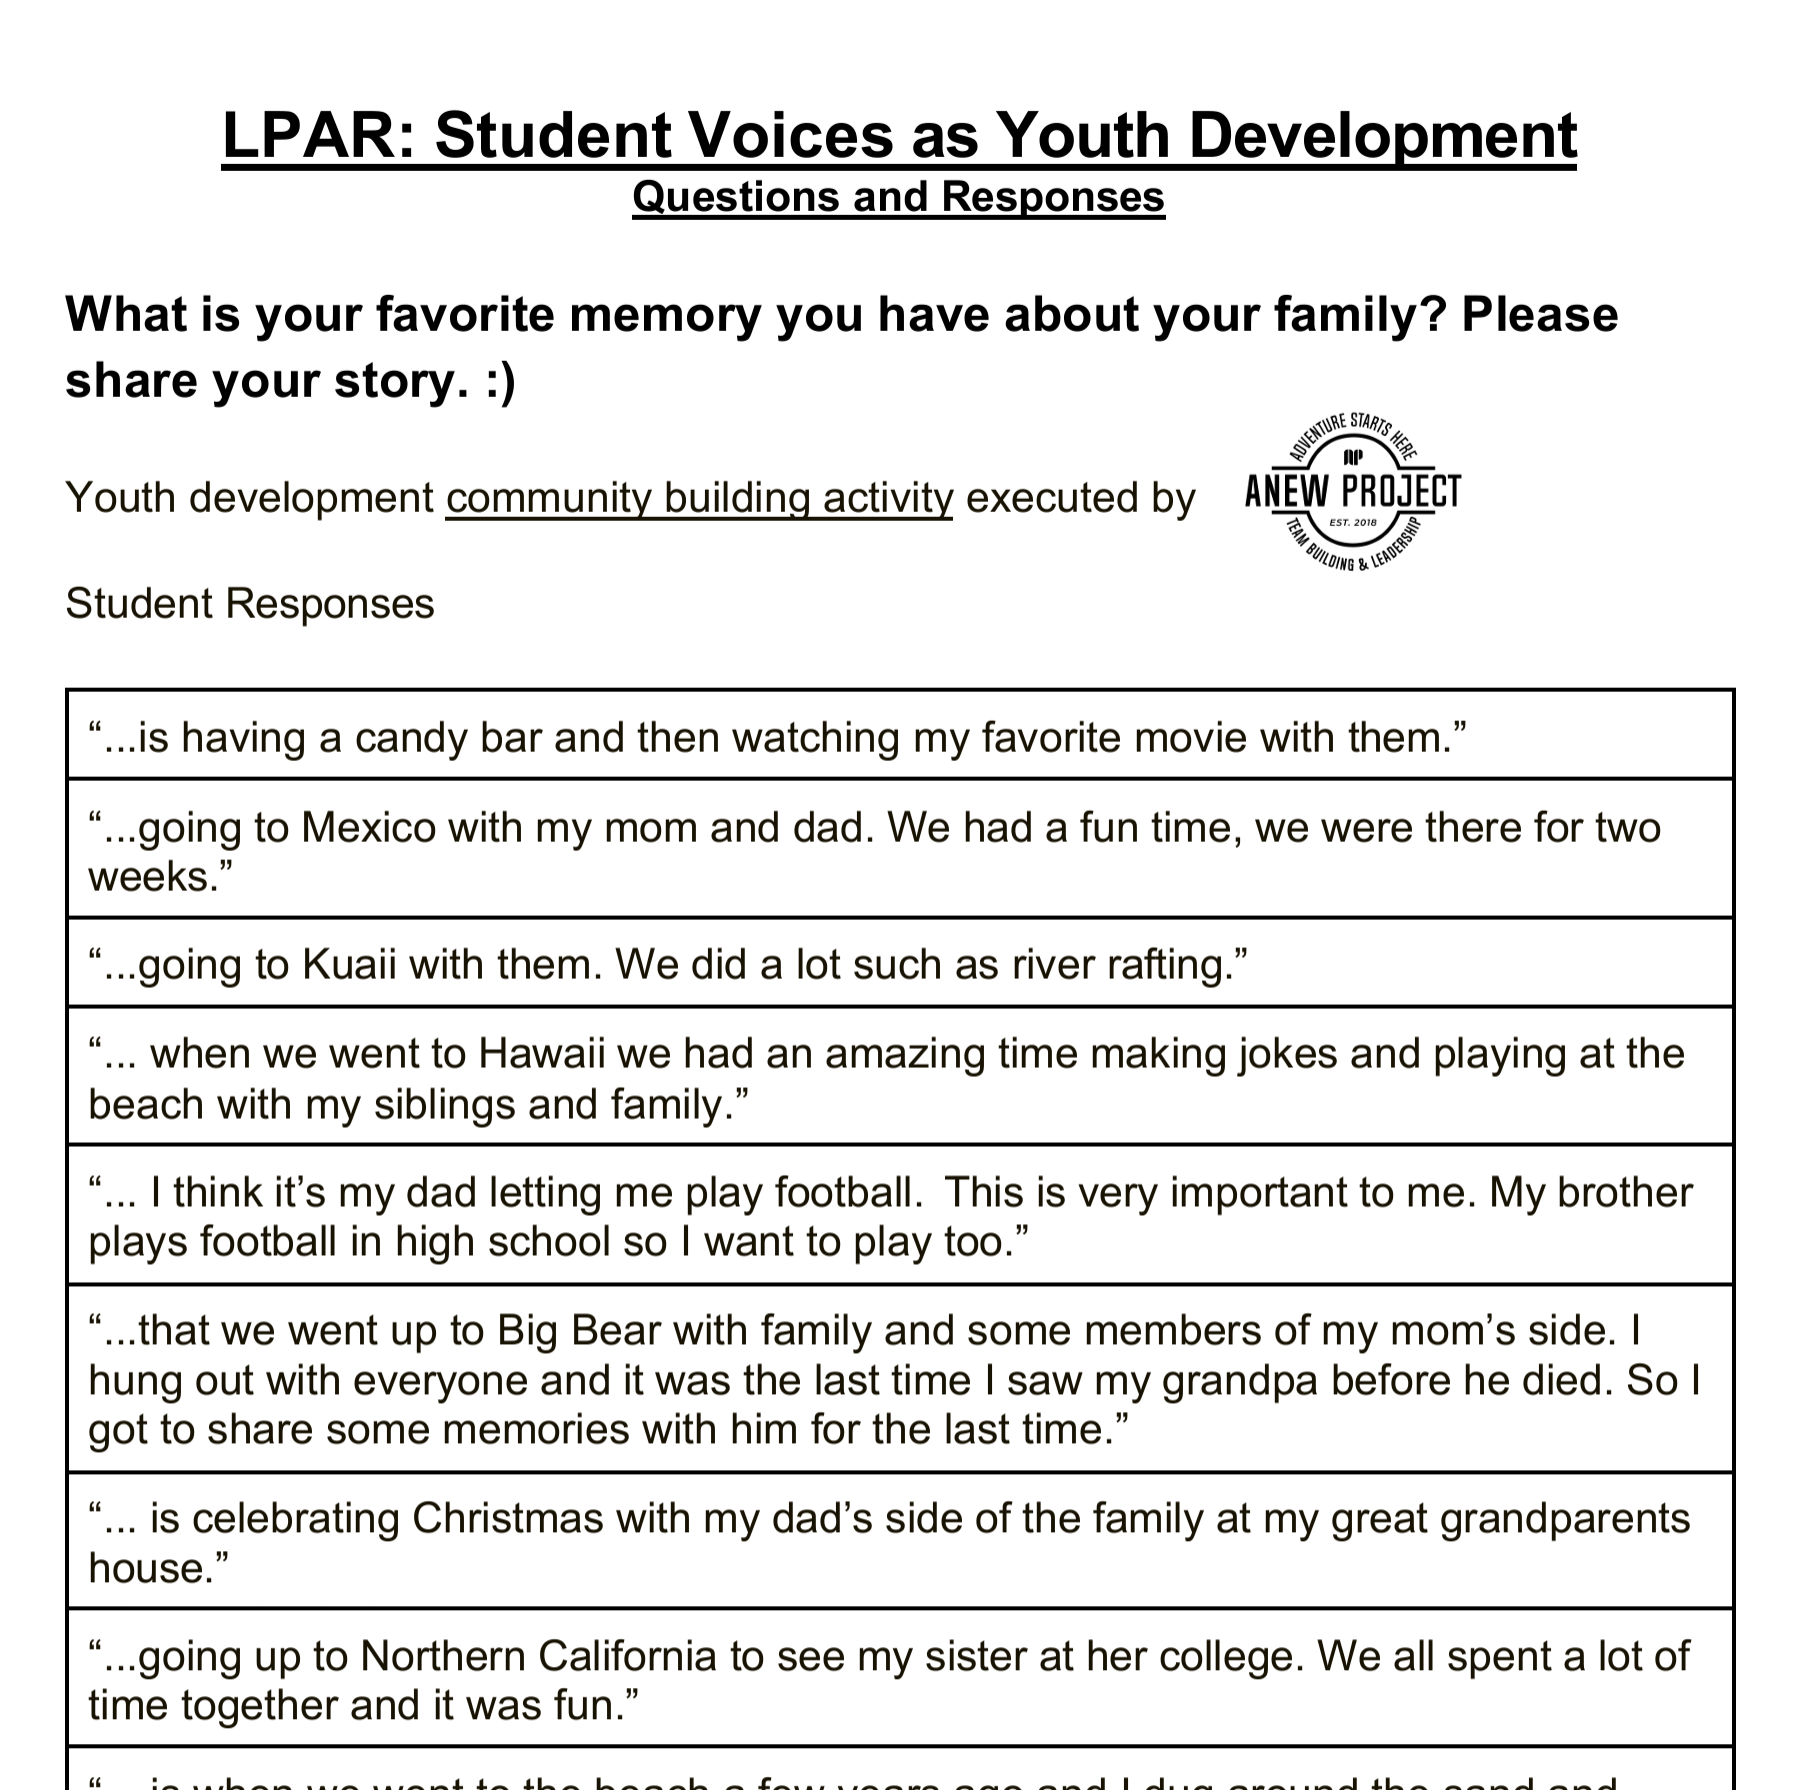
“LEADERSHIP PARTNERSHIP ACTION RESEARCH” Problem Statement:

The conditions for collection can limit student voice and empathy interviews. If collaborative partnerships created conditions for data collection to avoid tokenization and student voices were gathered within the context of belonging and community activities, what would the data tell us?

Featuring:

NEW AND INNOVATIVE WAYS TO COLLECT QUALITATIVE DATA

21

Our Favorites:
⦿ Your Story Matters - A Safe-Space Workbook
⦿ The Road Map - Reflection Activity
⦿ Passion, Love & Community - Whiteboard Reflections

A few children playing outdoors in a park, some standing near a wooden structure, and others gathered around.
Black and white photo of a person using a laptop behind a wooden desk, with a smartphone, notebook, and pen nearby.
Group of people standing outdoors, holding colorful hula hoops, engaging in an activity, with trees and a building in the background.
Logo of the San Diego County Office of Education Equity Department and JPX with a stylized mountain symbol in black.

In Partnership With:

Our Data Collection Supporting Resources

GET IN TOUCH!